- Research Article
- Open access
- Published:
Cross-Layer Dynamic Spectrum Map Management Framework for White Space Applications
EURASIP Journal on Wireless Communications and Networking volume 2010, Article number: 870976 (2010)
Abstract
White space, unused TV spectrum, will be allowed for unlicensed use by wireless communication devices "the so called white space applications (WSAs)." WSAs retrieve a location-based spectrum map, a list of open white space channels, from a spectrum map server and can select one on the list as their operating channel for the broadband Internet access. However, since not only primary users such as TV broadcasting services use white space shortly or longly but also neighboring WSAs do, WSAs need to perform spectrum sensing that determines the occupancy status, either occupied or unoccupied, of white space channels and select one among the unoccupied channels according to the spectrum sensing results. In a conventional spectrum sensing, they can execute unnecessary spectrum sensing on the already occupied channels. This paper proposes a dynamic management framework of white space that extends a spectrum map to contain occupancy information with the assistance of WSAs. Our framework enables WSAs to avoid unnecessary spectrum sensing on the channels that are marked as occupied according to the extended spectrum map. In return for the provision of the spectrum map, a spectrum map server obtains the spectrum sensing results of associated WSAs to update the extended spectrum map about the channel occupancy status. Theoretical analysis indicates that the proposed framework can contribute to shortening the total spectrum sensing time of WSAs by up to 50%.
1. Introduction
In November 2008, the Federal Communications Commission (FCC) [1] announced that white space applications (WSAs) or devices (WSDs) that do not interfere with primary users or applications such as TV broadcast services will be allowed to operate on white space, locally unused TV spectrum, for the wireless broadband Internet access. According to the FCC rules, WSAs should be able to connect to a public database server "a so-called spectrum map server" or another database server such as "a so-called radio resource management (RRM) server" that provides a location-based spectrum map. By retrieving the spectrum map of the current location, WSAs can implement the protection of primary users by performing spectrum sensing on the only channels that are open for unlicensed use according to the retrieved spectrum map. However, every location has the different number of open channels for WSAs, and primary users such as TV broadcasting services and wireless microphones can dynamically occupy unused channels. Thus, WSAs must perform spectrum sensing after retrieving the spectrum map of the current location whenever they start their service, their location changes, or they recognize the change of the wireless environments of white space. Multiple standard or industry-led groups such as IEEE [2], White Space Database Group [3], and ECMA [4] have been involved in developing white space standards.
The FCC rules are mainly focused on the protection of primary users and allow WSAs to share white space channels in compliance with spectrum etiquette that defines the basic rules in spectrum sharing among unlicensed WSAs. However, this spectrum etiquette has no authority to force selfish WSAs, which at least follow the FCC rules, to yield their operating channel. According to [5–9], WSAs can find their operating channel in noncooperative ways such as dynamic frequency selection or dynamic frequency sharing without the assistance of neighboring WSAs. However, to increase the efficiency of channel selection, WSAs can find their operating channel using spectrum auction or leasing mechanisms that are managed by a spectrum management controller [10–15]. For instance, a decentralized controller can conduct the spectrum map management of a local area while a centralized controller can provide spectrum map management over all areas. Regardless of the spectrum management techniques that WSAs depend on, we prefer the method that one WSA exclusively operates on one white space channel at one location. This exclusiveness is different to spectrum management of other unlicensed access networks such as WiFi, which permits multiple devices to operate on the same channel with less concerning for the collision or the service degradation with neighboring WiFi devices.
As a coordinated method of the above two approaches, multiple WSAs can share one channel using message-based spectrum contention [16] that schedules exclusive access in a promised set of data frames within a superframe. In addition, using transmit power control, WSAs can adjust their transmit power after negotiating with neighboring WSAs to generate less interference to neighboring WSAs. Newly joining WSAs will be pleased if anyone can inform which channels are unused at the current location of the WSAs. Based on this preference, we suggest extending the role of a spectrum server that provides not only a spectrum map but also the channel occupancy status, either occupied or unoccupied, with extra information. Using an extended spectrum map having the occupancy status, newly joining WSAs can reduce the scope of spectrum sensing from all white space channels to a small number of channels that are suspected to be unoccupied. As the return of the retrieved spectrum map, newly joining WSAs could send the spectrum sensing results to the spectrum server to assist the server in building and dynamically updating the spectrum map with the occupancy status extracted from the spectrum sensing results. Throughout this paper, the RRM server represents the spectrum server that provides the extended spectrum map. If any WSAs do not cooperate in constructing the dynamic spectrum map, their neighboring WSAs that are willing to provide their spectrum sensing results to the RRM server can detect these noncooperative WSAs at the same or neighboring location. In this case, the RRM server can recognize the existence of noncooperative WSAs from the spectrum sensing results of registered WSAs, which are neighbors of the noncooperative WSAs.
As a result of cross-layer cooperation between WSAs and the RRM server, newly joining WSAs with the dynamic spectrum map are capable of not only shortening the total spectrum sensing time but also decreasing interference to neighboring WSAs by reducing the possibility of miss detection. This paper consists of the following sections. Section 2 describes the dynamic spectrum map management architecture, technical challenges, and solutions. Section 3 explains the dynamic spectrum map management by exploring the extent to which the RRM server manages the dynamic spectrum map and the newly joining WSAs use the dynamic spectrum map in a channel selection. Section 4 explains the extent to which we conduct theoretical analysis and what analysis results we have. Section 5 summarizes our work.
2. Dynamic Spectrum Map Architecture
WSAs and the RRM server act as the main system components on the dynamic spectrum map architecture.
2.1. Network Reference Model
Figure 1 depicts a network reference model of dynamic spectrum management. In this reference model, we do not support WSDs operating in ad-hoc mode, and client-based white space portable devices (WSPDs) that may have multiple licensed and/or unlicensed wireless interfaces can associate with one or multiple infrastructure-based white space access points (WSAPs). Depending on the purpose of WSPDs, we can have three types of client-based WSPDs, Type 1, Type 2, and Type 3, as depicted in Figure 1. A Type 1 WSPD has licensed and unlicensed wireless interfaces while a Type 2 WSPD and a Type 3 WSPD have only white space interfaces. Thus, two WSPDs supporting different white space standards cannot communicate as depicted in a stop mark of Figure 1. However, if neighboring WSAPs can support interfaces between WSAPs and the RRM server such as RRM-SU1, RRM-SU2, and RRM-SU3 in Figure 1, they can offer the spectrum sensing results to the spectrum server and retrieve the spectrum map. The RRM server retrieving the spectrum sensing results of registered WSAPs builds the location-based spectrum map containing the channel occupancy information.

A network reference model for dynamic spectrum map management.
2.2. Structure of Spectrum Map
The RRM server builds the spectrum map of every location, and let denote  a list of white space channels when
  is the total number of white space channels, and
  contains channel information,
  , of the
  th channel.
  indicates whether the
  th channel is occupied, one, or unoccupied, zero, and
  presents what kind of standard or service is used when the
  th channel is occupied. On white space channels, we can have primary users such as TV broadcasting services and wireless microphones that must be protected from white space applications. In addition, since heterogenous white space devices can coexist, thus, supporting coexistence of homogeneous and/or heterogenous white space devices become a major issue. In this paper, we consider transmit power control (TPC) as the only coexistence mechanism. We can use
  of the
  th channel that indicates a service type of devices operating on the
  th channel, and we can use
  of
of  th channel that indicates coexistence mechanisms supported and allowed by the WSAP operating on the
  th channel.
  is a reliability index that scales the reliability of the presented channel information. Due to the inaccuracy of spectrum sensing techniques, the channel information of the spectrum map depending on the spectrum sensing results becomes inaccurate. Thus, WSAPs use
  as a barometer of the accuracy of the spectrum map. If
  is greater than a certain threshold, the WSAPs regard the given channel information as reliable. We present more details how to manage
  on Section 3.
Along with the spectrum map, WSAPs manage a list of backup channels,  , that are not currently occupied but neighboring WSAPs regard them as their recovery channels to prepare the inevitable case of switching their operating channel. This event can occur in a case of the unexpected appearance of primary users on their current operating channel. Thus, the best channel selection is to find the channel that its channel occupancy is unoccupied and is not considered as the backup channel of neighboring WSAPs. The list of backup channels,
  , is used in a channel selection procedure for checking above conditions.
2.3. Spectrum Map Lifecycle
In the RRM server, as described in the previous section, every geolocation has its own spectrum map, and the spectrum map stays either in the learning stage or in the serving stage. When the RRM server creates the spectrum map of the new location, the new spectrum map starts from the learning stage. In the learning stage, the RRM server can figure out a usage pattern of white space channels through analyzing the spectrum sensing results retrieved from associated WSAPs operating in the new location, and then, the RRM server can update the spectrum map with the occupancy status,  , of white space channels. After the successful update, the spectrum map is maintained in the serving state, in which the RRM server can provide it to newly joining WSAPs while the RRM server continues to update the spectrum map with the retrieved spectrum sensing results from associated WSAPs.
In the serving stage, we have two approaches of retrieving the spectrum map: a centralized approach and a decentralized approach. The centralized approach is to retrieve the spectrum map from the RRM server while the decentralized approach is to retrieve it from neighboring WSAPs. Through coexistence beacon frames, WSAPs can broadcast their revised spectrum map that reflects the spectrum sensing results not only from their own spectrum sensing but also collected from their associated clients. Thus, the WSAPs that can interpret coexistence beacon frames of their neighboring WSAPs can update their spectrum map and spectrum sensing results with the spectrum map of their neighboring WSAPs and provide their updated spectrum sensing results to the RRM server. The spectrum sensing results merging the spectrum sensing results of neighboring WSAPs can contribute to the increase in the accuracy of the spectrum map. However, when the accuracy of the spectrum map becomes less than a certain level, the spectrum map starts from the learning stage again.
2.4. General Flow of Spectrum Map Management
Figure 2 illustrates the general flow of channel selection conducted by newly joining WSAPs, and the selection consists of three operation phases: the preparation phase, the decision phase, and the monitoring phase. In the preparation phase, the newly joining WSAPs with the retrieved spectrum map build a list of white space channels targeted for spectrum sensing and execute spectrum sensing on channels included on the target list as the initial step of the decision phase. If they find one or more unoccupied channels from the spectrum sensing results, they select their operating channel among unoccupied channels, and if they succeed in spectrum access on the selected channel, they start their service in the active state on the channel. Otherwise, they execute the second spectrum sensing on the channels that were not included on the target list for the first spectrum sensing. In fact, since they can fail in spectrum access on their selected operating channel because of the inaccuracy of spectrum sensing, they continue to examine the next available channel among unoccupied channels until they succeed in spectrum access on the channel. However, if they fail in all attempts, they start from the preparation phase by redefining the target list for spectrum sensing. On the other hand, if they succeed in spectrum access on their selected operating channel, they immediately move to the monitoring phase and continue to monitor the wireless environments of their operating channel. They can also request associated white space clients to report their spectrum sensing results. In the monitoring phase, they prepare a case of switching their operating channel from the current one to another unoccupied channel because of the sudden appearance of primary users or their encounter with a low performance on the current operating channel for a certain time. Thus, activated WSAPs must periodically execute spectrum sensing on white space channels, and, thus, they can also provide the additional spectrum sensing results to the RRM server.

A general flow of a channel selection procedure with the extended spectrum map.
Figure 3 illustrates the extent to which newly joining WSAPs perform a channel selection. Updating the spectrum map with the spectrum sensing results occurs on both the RRM server and the WSAPs. At the stage of building the target list of spectrum sensing, the WSAPs do not include occupied channels on the target list according to the spectrum map. For instance, they exclude the second channel and the other channels such as the fifth one on the target list as depicted in the second step of Figure 3. After spectrum sensing, they now recognize that the occupancy status of some channels on the target list does not change while the occupancy status of the others changes. They apply these spectrum sensing results to the update of the spectrum map stored in their internal memory and deliver the updated spectrum sensing results to the RRM server in a report message as the most recent spectrum sensing results in the location where they operate.

An example of a channel selection procedure with the proposed framework.
2.5. Asynchronous Update of the Spectrum Map
While the WSAPs rely on their own spectrum sensing results mostly, the RRM server believes the retrieved spectrum sensing results partly, which is proportional to the accuracy of spectrum sensing techniques. Since all WSAPs can have different spectrum sensing techniques, they can have the different accuracy of spectrum sensing results from diverse registered WSAPs. Thus, to handle this instability in the accuracy of spectrum sensing results, the RRM server manages the accuracy index,  , that numerically scales the reliability of the occupancy status information of every white space channel on the spectrum map. Since newly joining WSAPs build a list of unoccupied channels for spectrum sensing in compliance with the retrieved spectrum map, spectrum sensing results include the current occupancy status of the only channels on the target list. Thus, the update of the occupancy status with the spectrum sensing results from one WSAP is not applied to all white space channels. In other words, the update of the occupancy status of every channel occurs asynchronously with the spectrum sensing results retrieved from the diverse accuracy of spectrum sensing techniques, and that is the reason why the RRM server maintains
  per channel.
The RRM server has multiple ways of calculating the accuracy index of a channel depending on whether the channel is included on the target list for spectrum sensing and whether the channel was selected as the operating channel. As depicted in the bottom of Figure 3, if a newly joining WSAP selected the  th as its operating channel, the calculation of the accuracy index for the
  th channel has two ways,Update-1 andUpdate-2, depending on success in spectrum access. Otherwise, except the operating channel, for the channels included on the target list such as the first channel in Figure 3, the RRM server calculates the accuracy index withUpdate-3. For the rest of channels excluded on the target list, the RRM server calculates the accuracy index with Update-4. We describe more details of calculating the accuracy index on Section 3.1.
2.6. Technical Challenges and Solutions
In the extension of the RRM server, maintaining a radio resource map that matches the real radio environments of white space channels for all locations will constitute multiple technical challenges. For one, the RRM server should have a large number of WSAPs that connect to the RRM server. Depending on the density of activated WSAPs at a location, the change in the channel occupancy status will occur either dynamically or slowly. If the RRM server has only a few WSAPs that inform the server about a change in the channel occupancy in a densely populated area, the RRM server cannot build a reliable radio resource map or the spectrum map that reflects the latest occupancy status of white space channels. Another challenge is that the spectrum map depends on the accuracy of spectrum sensing since all WSAPs determine the channel occupancy based on spectrum sensing results. As the accuracy of spectrum sensing increases, the accuracy of the spectrum map increases. However, the RRM server cannot always retrieve the spectrum sensing results of high spectrum sensing techniques since heterogenous WSAPs have their different target applications and/or spectrum sensing techniques. Thus, the RRM server obtains diverse spectrum sensing results that contain the rather different radio environment reports in the same location. In addition, although previous researches studied the evaluation metrics of spectrum sensing based on the characteristics of spectrum sensing techniques such as energy detection [17] and feature detection [18], they do not numerically scale the values of evaluation metrics. For example, Table 2.2 of [9] presents a comparison of multiple spectrum sensing detectors, which summarizes the characteristics of multiple spectrum sensing detectors with three properties:computational complexity, sensitivity to synchronization errors, and robustness to noise uncertainty. They only define evaluation values to be relative comparison to each detector as High or Moderate, and, thus, the RRM server cannot use these evaluation values to update the accuracy index of channels on the spectrum map.
To resolve the first challenge, which requires a certain large number of registered WSAPs for a high reliability of the spectrum map, we need to invent a way of analyzing the real environments of white space channels with the assistance of only registered WSAPs until they reach the certain number. Thus, we suggest that the RRM server conducts the analysis of network environments of white space channels based on the retrieved spectrum sensing results from registered WSAPs. Through monitoring the change of the occupancy status of white space channels, the RRM server can estimate the density of WSAPs, and Section 3.1 describes the extent to which the RRM server does it. A keyword in the second and third challenges is heterogeneity in spectrum sensing techniques, and based on this keyword, we can redefine two challenges into the following problems: the support of spectrum sharing between heterogeneous WSAPs and the accuracy management of the spectrum map. Since heterogeneous WSAPs cannot directly communicate or perform cooperative spectrum sharing mechanisms, we suggest that the RRM server acts as a main coordinator of supporting spectrum sharing and managing the accuracy of the spectrum map with the assistance of registered WSAPs.
3. Dynamic Spectrum Map Management
The RRM server can effectively lead dynamic spectrum map management by accommodating any type of WSAPs having different access standards as long as they can communicate with the RRM server.
3.1. Spectrum Map Information Management
To support spectrum sharing between heterogeneous WSAPs and to manage the accuracy of the spectrum map, the RRM server should be able to analyze the real network environments of white space channels from the spectrum sensing results of registered WSAPs. Thus, we suggest that the RRM server collects the following parameters:
-
(i)
the number of WSAPs that made the report messages of the spectrum sensing results,
-
(ii)
the number of occupied channels and detected neighboring WSAPs from each report message,
-
(iii)
the number of the activation and the deactivation of WSAPs,
-
(iv)
the duration time of one channel to be occupied with the start and end times.
Once the RRM server finishes the collection of the above parameters, the RRM server can estimate the following parameters:
-
(i)
the average duration time of one channel to be occupied,
-
(ii)
the average number of occupied channels and detected neighboring WSAPs,
-
(iii)
the average interarrival time between two report messages,
-
(iv)
the average number of report messages during a pre-defined duration.
The RRM server will use  that represents the average interarrival time between two report messages to decide a wait time for a next report message. In addition, by simply dividing the average duration time by the average interarrival time, the RRM server can estimate the average number of simultaneously activated WSAPs that connect to the RRM server (
 ). Meanwhile, using the average number of occupied channels and detected neighboring WSAPs, the RRM server can also estimate the average number of neighboring WSAPs,
  . We define the ratio of the two numbers,
  , that represents the percentage of the total number of WSAPs that connect to the RRM server. Thus, for a high accuracy of spectrum sensing,
  should approaches 1. With a calculated
  , we suppose the network environment of white space channel in the location of WSAPs.
Every channel information of the spectrum map includes the accuracy index,  , that numerically scales the reliability of the occupancy status of the channel in the spectrum map. Let
  denote
  of the occupancy status of the
  th channel. When the RRM server creates the spectrum map of all the locations for the first time, it sets
  to zero for all channels. Now, the RRM server, which retrieves the spectrum sensing results of the
  th channel at a location for the first time, initializes
  with the probability of detection,
  , of spectrum sensing techniques of the WSAP that reported the spectrum sensing results. After the server updates
  once, the server updates
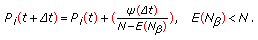
  in two different situations, before and just after retrieving a report message. Until the server retrieves a next report message from any WSAP at location
  within
  time, which follows the exponential distribution as depicted in Figure 4(a), the server applies the exponential decrease in
  of location
  with the following equation:

where  for the
  th channel is initialized with
  (
( of spectrum sensing of the WSAP sent the first spectrum sensing results), and
  is given by
  when
when  is the duration time of the consecutive expirations of
  timers. If the server fails to retrieve an expected next report message and instead, retrieves a sign of the expiration of the
  timer, the server restarts the new
  timer after updating
  with (1).

Calculation of the accuracy index of the  th channel. with consecutive expirations of
  timers.with a report message.
However, when the server retrieves a report message before the  timer is expired, the server has three choices of updating
  : no change as depicted inUpdate 1 of Figure 4(b), initialization with a given
  as depicted inUpdate
 , or initialization with one as depicted in Update 4. The first choice,Update 1, is that the RRM server does not update
  if the retrieved report message does not have the spectrum sensing results of the
  th channel at location
  since WSAPs did not execute spectrum sensing on the
  th channel. The second choice,Update
 , is that the RRM server updates
  with
with  of spectrum sensing techniques of the WSAP that sent the report message since the WSAP selected the
  th channel as its operating channel, but the WSAP failed in spectrum access on the channel. The second choice also includes the case of updating
  of all channels except the operating channel included in the spectrum sensing results. The third choice,Update 4, is that the RRM server updates
  with one, which indicates that the accuracy of spectrum sensing of the WSAP is reliable since spectrum access on the
  th channel was successful. Since the update of
  occurs asynchronously,
  of all channels can differ at any time. Now, we have five ways of updating
  consisting of one way in a case of the expiration of the
  timer and four ways,Update
 , in a case of the retrieval of the report message containing the spectrum sensing results.
3.2. Spectrum Map Creation Procedure
Newly joining WSAPs execute Algorithm 1 to build a list of channels for spectrum sensing, and inside the algorithm,  is used to decide whether the algorithm includes the
  th channel on the target list, which the spectrum map marked as unoccupied. If
  is greater than a certain threshold,
  , the algorithm regards the occupancy status information,
  , of the
  th channel on the spectrum map as reliable. Thus, the algorithm includes the
  th channel on the target list of spectrum sensing,
  , if
, if  is zero. In addition, the algorithm also includes any occupied channels, but if the white space standard,
  , of the newly joining WSAPs is same as the standard,
  , of neighboring WSAPs, which were previously detected by other WSAPs in the same location, operating on the
  th channel. This addition is designed to collect beacon frames of neighboring WSAPs and prepare an inevitable case of performing coexistence mechanisms because of the absence of unoccupied channels. In this case, the WSAPs can obtain the coexistence mechanisms supported by neighboring WSAPs from the collected beacon frames. The previous operations as shown in lines 7–13 are only meaningful when
  is greater than or equal to
  , and otherwise, the algorithm includes the
  th channel on the target list only if the channel is not used by primary users as shown in lines 15-16.
Algorithm 1: CreateSpectrumSensingList.
-
(1)
Procedure Cr e a t e Sp e c t r u m Se n s i n g Li s t


(2) 
 0
0
(3) for do
do
(4) Begin
(5)  of
of  in
in 
(6) If then
then
(7) Begin
(8) If then
then
(9) 
(10) else
(11) If then
then
(12) 
(13) End
(14) else
(15) If then
then
(16) 
(17) End
(18) return 
(19) end Procedure
3.3. Spectrum Sensing Result Retrieval
On all channels on the built target list,  , the newly joining WSAPs perform spectrum sensing. Regardless of spectrum sensing schemes, they expect a retrieval of spectrum sensing results,
  , a set of
  of all channels included on
  with
with  of the spectrum sensing schemes.
  of the
  th element on
  is the channel number of the white space channel where its spectrum sensing results are stored in the
  th element on
  ,
,  indicates the occupancy status according to the spectrum sensing results, and
  indicates the existence of primary users operating on the channel or any detected neighboring WSAPs that support the same access standard of the newly joining WSAPs. For instance, we can define
  to have one of values,
  ,
,  ,
,  ,
,  ,
,  , and
, and  .
.  represents TV broadcasting services,
  does wireless microphones, and
  represent different unlicensed white space standards while
  indicates that the access standard of detected neighboring WSAPs is unknown. If the WSAPs locate in a densely populated area, they can detect multiple neighboring WSAPs operating on the same channel. If all detected neighboring WSAPs are homogenous, the WSAPs can build a list of neighboring WSAPs by interpreting retrieved beacon frames of neighboring WSAPs, and this list is useful if the WSAPs need coexistence mechanisms in a matter of spectrum sharing. For instance, depending on coexistence capability of the WSAPs and the neighboring WSAPs, they can negotiate the adjustment of their transmission power for coexistence. At that moment, the WSAPs can use
  and
and  to decide whether the negotiation of coexistence with the neighboring WSAPs is affordable or not.
Let us denote  ,
, ,
, ,
, the spectrum sensing results of channels on
  , in which
  of the
  th element on
  has
has  of the
  th channel with the following extra parameters.
-
(i)
 : a list of the detected neighboring WSAPs on the
  channel. This is optional.
 -
(ii)Backup
channel flag (
 ): the flag that indicates whether the
  channel is a potential backup channel for neighboring WSAPs.
 : a list of the detected neighboring WSAPs on the
  channel. This is optional.
 ): the flag that indicates whether the
  channel is a potential backup channel for neighboring WSAPs.
In addition, the WSAPs maintain the following list:
-
(i)
 (
( ): a list of channels included on
  , which their occupancy status according to
  is unoccupied, but its real occupancy status is occupied according to the spectrum map of neighboring WSAPs.
 (
( ): a list of channels included on
  , which their occupancy status according to
  is unoccupied, but its real occupancy status is occupied according to the spectrum map of neighboring WSAPs.
The WSAPs build  with
with  and
and  of the neighboring WSAPs extracted from the retrieved coexistence beacon frames.
3.4. Spectrum Selection Procedure
Based on the acquired spectrum sensing results, the newly joining WSAPs perform the selection of their operating channel. With  and
and  , the WSAPs execute Algorithm 2 for a channel selection, and the algorithm consists of two steps: the collection of unoccupied channels and the selection of the operating channel. In the first step, as shown in lines 3–8, the algorithm searches unoccupied channels on
  . Since the
  index on
  ,
,  , and
, and  no longer indicates a channel number, we use the
  field to indicate a channel number. If the occupancy status of the
  th channel,
  , is zero, the algorithm adds
  to a list of candidate channels for the operating channel,
  . The algorithm executes the previous operation on all channels on
  and counts the size of
  . If the size is only one, the algorithm declares the
  th channel on
  as the operating channel of the WSAPs. However, as shown in lines 16–19, the size of
  can be greater than one, which means that we have multiple unoccupied channels. In the second step, the algorithm calls the selOneFromMultiples function that selects one channel among multiple ones.
Algorithm 2: ChannelSelection.
(1) procedure Ch a n n e l Se l e c t i o n
(2) 
(3) for do length
(4) Begin
(5) 

 of
of  in
in 
(6) If then
then
(7) 
(8) End
(9) If then
then
(10) return 
(11) else
(12) Begin
(13) If then
then
(14) return selOneFromMultiples (
(15) else
(16) If then
then
(17) # returnTransmit Power Control
(18) else
(19) return null
(20) End
(21) return null
(22) end procedure
(23) Procedure SeloneFromMultiples ( )
)
(24) for do
do
(25) Begin
(26) If and
and  found on
  then
then
(27) return 
(28) End
(29)  rand(length(
 ))
))
(30) return 
(31) end procedure
In  , the algorithm attempts to find any candidate channel that is also not detected as the backup channel for neighboring WSAPs. The previous operation can find one or more candidate channels, which are unoccupied and not backup channels of neighboring WSAPs. In this case, the function simply returns the first channel as shown in the line 27. However, if all unoccupied channels are backup channels for neighboring WSAPs, the function randomly selects one of them as shown in line 29. The WSAPs perform spectrum access on the selected operating channel, and if it is successful, they move to the active state to provide the broadband Internet access for their customers along with the update of the spectrum map. Otherwise, they repeat the new channel selection procedure, which executes Algorithm 2 and performs spectrum access on a new selected operating channel, after deleting the current operating channel from
  .
.
When the size of  is less than one, which means that the algorithm failed in searching any unoccupied channel, the algorithm can conduct TPC if
  is greater than
  or the second spectrum sensing on channels that were not included on
  of the first spectrum sensing. However, If the WSAPs failed in the second spectrum sensing, they can finally decline their activation and wait until some channels are released, or as shown in line 17, they can also conduct TPC.
3.5. Spectrum Map Update Procedure
Regardless of success or failure in spectrum access, the WSAPs execute Algorithm 3 that updates the retrieved spectrum map with the spectrum sensing results. Along with  and
and  , the algorithm obtains the values of ind and ac parameters as the results of the channel selection and spectrum access procedures. Ind represents the success or the failure of spectrum access, and
  represents a channel number of the operating channel. The algorithm updates
  of the channels on
  with the above update rules as shown in lines 8–13 and also updates the
  and
and  fields of the channels on
  if spectrum access was successful and the accuracy of spectrum sensing is greater than or equal to
  as shown in lines 15-16. In fact, the algorithm executed in the WSAPs does not conduct lines 6–14 because the RRM server is only responsible for updating
  . However, as shown in lines 15-16, the algorithm in the WSAPs updates
  and
and  fields, which are internally stored in the WSAPs, and the WSAPs use the updated local spectrum map in a next channel selection or switching until they retrieve the newlyupdated spectrum map from the RRM server or the new spectrum map of the new location as the WSAPs move to the new location.
Algorithm 3: SpectrumMapUpdate.
(1) procedure Sp e c t r u m Ma p Up d a t e (Ind, ac,  ,
,  ,
,  ,
,  )
)
(2) 
(3) for do
do
(4) Begin
(5) 

 of
of  in
in 
(6) If =
=  then
then
(7) If =
=  then
then
(8)  = 1
= 1
(9) else
(10)  =
= 
(11) else
(12) Begin
(13)  =
= 
(14) End
(15) If(ind = success) or (

 )then
)then
(16)  ,
, 
(17) End
(18)  ;
;
(19) end procedure
While the WSAPs operate in the active state, they perform a periodic spectrum sensing on their operating channel and another channel regardless of the occupancy status of the other channel as the WiFi devices do. For example, 802.11 a/g devices can scan 11 channels within the default 180 seconds (50 ms scan time on each channel every 16 seconds). The same approach on WSAPs can amend a corrupted spectrum map indicating a particular channel as occupied, but the channel is in fact unoccupied. This amendment takes a little longer time than the case that the newly joining WSAPs execute the second spectrum sensing against the channels excluded from the first spectrum sensing. Through a periodic scan, our proposed framework builds more reliable spectrum map as more spectrum sensing on the active state continues. To validate the retrieved spectrum map results, the RRM server will only accept the spectrum sensing results from registered WSAPs. However, this paper does not provide specific identification schemes, which is beyond the scope of this paper. In addition, to resolve conflicts that can occur because of the diverse spectrum sensing results from heterogeneous WSAPs having different spectrum sensing techniques, the RRM server prefers the most recent spectrum sensing results of spectrum sensing techniques having a high accuracy.
4. Theoretical Analysis
For theoretical analysis of the proposed dynamic spectrum management framework, we adopt theM/G/m/m queueing model to define theM/B/N/N model as the evaluation model of dynamic spectrum management. In ourM/B/N/N queueing model,  indicates that the activation of newly joining WSAPs follows a Poisson distribution, and
  indicates that a service duration time follows a bounded Pareto distribution. With the
  number of white space channels, the second
  indicates that newly joining WSAPs will fail in finding unoccupied channels if the number of activated neighboring WSAPs is greater than
  . In addition, Table 1 shows the values of parameters for evaluating dynamic spectrum management. We refer to the duration time of speech of 120 seconds as the minimum session duration time [19] and 12 times the duration time to watch web videos [20],
  seconds, as the maximum session duration time. A newly joining WSAP will send one report message to the RRM server since the WSAP should connect to the RRM server to retrieve the spectrum map. Since the average interarrival time of two consecutive report messages follows an exponential distribution, its probability density function (pdf) is expressed as
  , in which
  is the average number of active WSAPs,
  is the density of the WSAPs, and
  is the average distance of service coverage. The pdf of the service duration time, which follows the bounded Pareto distribution, is expressed as
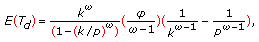
where  is 1.2 [21]. With
  and
and  in Table 1, we have
  seconds, and
  is calculated by
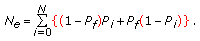
  . We estimate the blocking probability,
  , and the expected number of active WSAPs,
  , using the following equations:
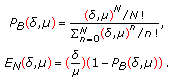
In our analysis, instead of  represents the average number of WSAPs, which is expressed as

where  is a duty cycle of WSAPs, and
  is the density of WSAPs, in which
  is the average number of WSAPs, and
  is the unit area. This paper sets
  to one, which means one call per hour for every WSAP. Even though
  is one in theoretical analysis, the activities of spectrum allocation and release are based on one service life cycle. For example,
  in Table 1 refers to the mean time of one white space channel occupied by one WSAP. This indicates that one channel will be dynamically allocated to a newly joining WSAP for
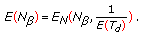
  seconds. When the WSAP terminates one session, it may turn into a dormant state, and it will release the channel. Using (2), (3), and (4), we can calculate the expected number of activated WSAPs,
  , with the following equation:
In fact, depending on the accuracy of spectrum sensing or the probability of detection,  , newly joining WSAPs cannot successfully detect the
  number of neighboring WSAPs. Thus, we define
  , which reflects the accuracy of spectrum sensing in the calculation of the expected number of detected neighboring WSAPs. The following equation is used to calculate
  :
:

where  is the probability of the occupancy of the
  th channel at any time, and
  is the probability of false alarm. If WSAPs attempt to access all channels equally,
  becomes equal to
  , and we have a simplified
  . However, spectrum sensing, which can detect unoccupied channels as occupied because of miss detection, can detect occupied channels as unoccupied because of false alarm. Thus, we can calculate the number of channels misjudged by spectrum sensing with the following equation:
Using  and
and  , we define the spectrum sensing reliability index (SSRI), which is given by
and in theoretical analysis, we use  as
as  in the algorithms.
4.1. Accuracy of Extended Spectrum Map
Since the performance of the proposed framework relies on the accuracy of the extended spectrum map, we studied the extend to which  is affected by the environments of white space and the accuracy of spectrum sensing. According to (8),
  ,
,  ,
,  ,
,  , and
, and  are key parameters for evaluating the performance of
  . Thus, we define previous five parameters as the evaluation parameters for
  and the values of the parameters for the analysis of the performance of
  . By applying the values to (8), we evaluate the extend to which our framework performs according to
  .
.
Figure 5(a) illustrates the expected number of occupied channels for  and
and  when the density of WSAPs (
 ), the average rate of service time (
 ), and the expected number of simultaneously activated WSAP,
  , are known. With
  and
and  , the expected number of occupied channels reaches around half of 30 when
  reaches approximately 0.004. In the case of
  , the expected number reaches around half of 50 when
  reaches approximately 0.006. Based on this observation, we decide the range of the density of WSAPs for the theoretical analysis of spectrum sensing from 0.002 to 0.02, and we regard
  beyond 0.008 for
  and 0.012 for
  as the situation in which most channels are occupied.

The expected number of activated WSAPs with  and errorless spectrum sensing techniques when the density of WSAPs (
 ), the average rate of the service time (
 ), and the expected number of activated WSAPs,
  , are known (Subfigure (a)). versus the expected number of activated WSAPs with erroneous spectrum sensing techniques (Subfigure (b)). Subfigure (c) depicts the extent to which the Spectrum Sensing Reliability Index (SSRI) is affected with the known
  ,
,  ,
,  ,
,  , and
, and  .An ideal caseAn practical caseSpectrum Sensing Reliability Index (SSRI)
With given  ),
),  ,
,  ,
,  , and
, and  , we analyzed the extent to which they affect
  . As depicted in Figure 5(b), with
  and
and  , the difference of
  and
and  is about one channel. Even with a high probability such as
  and
and  , the difference between
  and
and  is less than five for
  and
and  . Thus, we disregard the impact of miss detection or false alarm in the calculation of the number of detected neighboring WSAPs in theoretical analysis. Figure 5(c) illustrates the calculated
  with
with  . With a low probability of miss detection and a low probability of false alarm,
  has a bigger value than
  with a high probability. For example, with
  and
and  ,
,  is greater than 0.9 for both
  and
and  while
while  for
for  and
and  is less than 0.8 and 0.5 for
  and
and  , respectively.
  with
with  , which approaches 0.5 for
  , approaches 0.5 for
  with
with  . According to the observation of the (c) label in Figure 5(a),
  reaches almost
  and 50 at
  and 0.012, respectively. Thus, the analysis indicates that the RRM server can provide a reliable spectrum map when
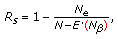
  is greater than 0.4, and we set the threshold,
  , used in Algorithms 1, 2, and 3 for
  to 0.4 in our analysis. We do not evaluate the performance of the proposed framework with
  .
.
4.2. Probability of Success in Channel Search
With a typical spectrum sensing approach, we can estimate the probability of success in a channel search with the following equation:

where  is a set of channels from 1 to
  , and
, and  is a set of
  chosen channels that are marked as unoccupied as the
  th combination among all possible ways of choosing
  channels from
  total channels.
  is zero when
  is greater than or equal to
  , and channel reusability, which can accommodate more WSAPs than the
  number of WSAPs at one location, is beyond the scope in this paper. However, with the extended spectrum map, we have two steps of spectrum sensing: the first spectrum sensing and the second spectrum sensing. Thus, we cannot use (9) to calculate the probability of success in a channel search with the extended spectrum map. Let
  denote the probability of the occupancy of the
  th channel at time
  . Thus, at any time
  ,
,  , which we refer to as occupied or unoccupied according to the spectrum sensing results, for occupied channels should be
  while
while  for unoccupied channels should be
  . In addition, we can calculate the number of channels on
  by
by  . Between two report messages, over a
  period, we can estimate the number of the newly activated neighboring WSAPs by
  , where
  is the interarrival time of the activation of two neighboring WSAPs with
  . These activations can occur without the notification of the RRM server. In other words, the newly joining WSAPs that are not registered to the RRM server probably occupy
  channels among
  unused channels. This unawareness of the activation of unregistered WSAPs can be possible since old-style WSAPs prefer a conventional spectrum map server instead of the RRM server. In general, since the newly joining WSAPs search their operating channel among unoccupied channels, we can estimate the number of unoccupied channels after
  from time
  with the following equation:
In (10), we are not concerned with  since that is beyond the scope of this paper. In fact, this paper assumes that the WSAPs can find at least one or more unoccupied channels after performing spectrum sensing, which means that
  is always less than
  . Now, using (9) and (10), we estimate the probability of success in finding unoccupied channels in the first spectrum sensing with the following equation:
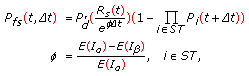
where  aims to reflect the degradation of
  ,
,  is the probability of detection of WSAPs that prefer spectrum sensing with the extended spectrum map, and
  is the
  of the WSAP sending the report message at time
  . With
  , we estimate
  , that is, the interarrival time of two report messages with
  , which is the average number of WSAPs that connect to the RRM server. In our analysis, we estimate
  with a given
  (
( ). In addition,
  is a scale parameter that controls a degradation range. For example, as
  approaches zero,
  decreases more smoothly compared to the case of
  approaching one. As registered WSAPs increase
  approaches
  , and, thus,
  approaches zero. This coincides in the fact that the RRM server can trust more the spectrum map with a high
  than the spectrum map with a low
  . With a low
  , since
  becomes greater than
  ,
,  approaches one resulting in a bigger decrease of
  .
.
While neighboring WSAPs that do not enroll in the RRM server occupy  channels among
  unused channels, some activated WSAPs will release their operating channel during the
  time, which will increase the probability of success in the second spectrum sensing. In fact, we expect that
  channels will be released during the
  time. However, if
  is greater than
  , newly joining WSAPs will occupy the channels released during the
  time, resulting in no change between
  and
and  . While
  represents the expected probability of success in the first spectrum sensing,
  represents the highest probability of success in spectrum sensing if all the channels on
  remain in the current occupancy status, occupied. Figures 6(a) and 6(b) with
  and
and  illustrate that the probability of success in a channel search approaches 80% when
  is less than or equal to 0.008 for
  and 0.012 for
  . Thus, we can have a high probability of success in a channel search in the first spectrum sensing until
  becomes greater than the saturation point. In addition, with a low
  such as
  under a low population such as
  or 0.006, WSAPs with the extended spectrum map can still perform around 80% success in a channel search in the first spectrum sensing. However, the RRM server, which fails to receive the spectrum sensing results of WSAPs within a certain time such as
  , cannot properly update
  , resulting in a low chance of success in the first spectrum sensing with a rather unreliable spectrum map. When the RRM server has the expiration of the
  (
( )) timer, the RRM server restarts the timer while
  of all channels in the spectrum map exponentially decreases. Figure 6(d) illustrates the extent to which
  decreases if the RRM server fails in retrieving the next expected report message. Nevertheless, the decrease in
  with a low
  such as 0.002 or 0.004, is insignificant as depicted in the (a) label of Figure 6(d) even after the RRM server has the third consecutive expiration of an
  timer. However, we can observe the drastic decrease in
  with a high
  . For instance, as depicted in the (c) label of Figure 6(d),
  with a high
  is already less than or equal to 0.3 at the first timer expiration.

With the spectrum sensing reliability index,  , the analysis results of the expected probability of success in the first spectrum sensing,
  , with
  and
and  in (a) and (c) are presented. In subfigure (b), for
  ,
,  varies from 0.010 to 0.018. Subfigure (a) and (b) indicate that a higher
  contributes to the drastic drop of the probability of success, which we observe in (c) labels of subfigure (a) and (b). In subfigure (c), with a lower
  ,
,  still approaches 80 % for
  and
and  . A subfigure (d) indicates the extent to which
  will decrease if we have consecutive expiration of
  timers.
 with
with  for
for 
 with
with  for
for 
 with
with  for
for 
 for
for  expirations with
  for
for 
When the WSAP fails in the first spectrum sensing, the WSAP launches the second spectrum sensing against either all channels or channels that were not included on  . This paper assumes that on the second spectrum sensing, the WSAP excludes the channels included on
  of the first spectrum sensing. During the
  time,
time,  ,
,  , for occupied channels is expressed as

Using (12), the probability of success in a channel search on the second spectrum sensing,  , is expressed as

As shown in Tables 2 and 3, as  increases,
  increases until
  meets the saturation point, for example, 0.008. After the saturation point, since any new arrivals should be denied because of the absence of unoccupied channels, the second spectrum sensing could achieve no more increase in performance. Compared to the case of WSAPs with a shorter service distance, with a longer service distance,
  of WSAPs, which experienced the failure of the first spectrum sensing at early time, increases. The previous observation indicates that the proposed framework can provide stable and predictable performance as long as we have proper operation parameters such as
  and
and  for every location through the learning stage of the spectrum map for all locations. In addition, while the enhanced accuracy of spectrum sensing techniques can contribute to improving the accuracy of the spectrum map, the proposed framework can also contribute to the improvement as more WSAPs register to the RRM server. The analysis shows that we need over 40% of all WSAPs that register to the RRM server and provide their spectrum sensing results.
 , with
  ,
,  , and
, and  = 30.
= 30. , with
  ,
,  , and
, and  .
.4.3. Average Spectrum Sensing Time
We estimate the expected total spectrum sensing time with a conventional spectrum sensing approach, which scans all white space channels, with the following equation:  , where
  is a time that takes for sensing one channel. We calculate the expected total spectrum sensing time with the proposed dynamic spectrum management,
  , using (14), as the sum of the expected time in the first spectrum sensing and the expected time of the second spectrum sensing

In the first spectrum sensing, the number of channels on  is
is  , and thus, the average time in the first spectrum sensing is calculated by
  . Since the number of channels for the second spectrum sensing is
  , the average time in the second spectrum sensing is calculated by
  . Figures 7(a) and 7(b) illustrate the expected spectrum sensing time with
  and
and  ms [4]. In contrast to 300 ms (=10 ms × 30 channels) of the conventional approach, with the extended spectrum map, the expected spectrum sensing time,
  , is below 300 ms. In addition, as
  approaches the saturation point,
  decreases. For example, in Figure 7(a),
  , which does not change until
  approaches 0.008, decreases after
  becomes greater than 0.008, which we can also observe in Figure 7(b). In addition,
  with
with  is below 200 ms, as depicted in Figure 7(c), with
  and
and  . However, from
  , we can observe increase in
  since a low
  results in a low
  because the expiration of the
  timer can highly occur. The previous observations indicate that increase in the number of WSAPs supporting the extended spectrum map can shorten the total spectrum sensing time under the condition that newly joining WSAPs can find at least one or more unoccupied channels (
 saturation point).

With the spectrum sensing reliability index,  , the analysis results of the expected spectrum sensing time,
  , with
  are presented. Subfigure (b) is the analysis results of
  for
for  m. Three subfigures depict that
  rather steeply increases when
  becomes greater than a saturation point. In subfigure (c), with a lower
  ,
,  still could be reduced significantly when
  is less than or equal to 0.008.
 with
with  for
for  m
m with
with  for
for  m
m with
with  for
for  m
m
4.4. Burden of Updating the Spectrum Map
We expect that the extended spectrum map requires only dozen bytes to be added to a message that WSAPs use to connect to a conventional spectrum map server when they start their operation. The added bytes will be used to indicate the occupancy status of all white space channels, and our proposed framework requires one more connection to the RRM server compared to a conventional approach. The conventional retrieval of the spectrum map occurs once when WSAPs starting their service while our proposal requires two retrievals when WSAPs connect and disconnect to the RRM server. Let denote  the number of bits in the message for the conventional retrieval of the spectrum map, and, then, we can calculate the total bandwidth of retrieving the spectrum map with
  . Our scheme requires
  , where size
  is the number of bits for storing channel information for one white space channel, and 2 means that our scheme updates two times related to the activation and the deactivation of WSAPs. In addition, we expect that computational complexity is ignorable since channel information is simply updated using Algorithm 3, and updating the accuracy index,
  , is also not complicated.
5. Conclusions
In this paper, we propose the dynamic spectrum map management framework that can enhance the efficiency of spectrum sensing with the cooperation between white space access points (WSAPs) and the extended spectrum map server, the RRM server. The RRM server that manages a location-based spectrum map can assist WSAPs to shorten the total spectrum sensing time. Since the accuracy of the spectrum map depends on the accuracy of spectrum sensing techniques, the RRM server should acquire the assistance from a certain number of WSAPs that provide their spectrum sensing results of a higher accuracy of spectrum sensing techniques. Theoretical analysis indicates that for the high accuracy of the spectrum map, the number of WSAPs supporting the proposed framework should be greater than 0.4 times the total number of all registered and unregistered WSAPs to the RRM server. In addition, the theoretical analysis indicates that we can save up to 50% of the expected total spectrum sensing time as the number of registered WSAPs increases.
The proposed framework assists not only newly joining WSAPs to improve their starting operation with the shortened total spectrum sensing time, but also already activated WSAPs to shorten their intermediate spectrum sensing time in the active state. Upon detecting unexpected appearance of primary users, all WSAPs perform spectrum sensing while their session is alive. For instance, in [4], WSAPs perform spectrum sensing at least once every 60 seconds, and within two seconds, WSAs are to vacate their operating channel if they detect the appearance of any primary users on their operating channel. To minimize the burden of spectrum sensing in every 60 seconds, we expect that WSAPs will scan their operating channel and one more channel, instead of all channels, at each periodic scan as the WiFi devices do. WSPAs can use the saved time to transmit more user data as a result of decrease in the number of channels for spectrum sensing. With the assistance of the proposed framework, activated WSAPs can recognize the appearance of primary users if neighboring WSAPs informed the RRM server of the existence of primary users. This cooperation between WSAPs and the RRM server can contribute to the early vacancy from white space channels. Based on these observations, we expect that the proposed cross-layer framework that integrates WSAPs and the RRM server can enhance the dynamic spectrum map management through the life cycle of the spectrum map.
References
Federal Communications Commission : FCC Adopts Rules for UnlicensedUse of Television White Spaces. November 2008
IEEE 802.22 Working Group on Wireless Regional Area Networks http://www.ieee802.org/22/
White Space Database Group : Tech Industry Leaders Join to Develop Guidelines for White Spaces Database. January 2009, http://www.google.com/intl/en/press/pressrel/20090204_whitespaces.html
Wang J, Song MS, Santhiveeran S, et al.: First Cognitive Radio Networking Standard for Personal/Portable Devicesin TV White Spaces. http://www.ecma-international.org/publications/files/drafts/tc48-tg1-2009-132.pdf
Zhao Q, Sadler BM: A survey of dynamic spectrum access: signal processing, networking, and regulatory policy. IEEE Signal Processing Magazine 2007, 24(3):79-89.
Pollin S: Coexistence and dynamic sharing in cognitive radio networks. In Cognitive Wireless Communication Networks. Edited by: Hossainand E, Bhargava VK. Springer, New York, NY, USA; 2007.
Lemstra W: Cognitive Radio defying Spectrum Management Acollection of four (short) contributions. Proceedings of the Conference on Competition and Regulation in Network Industries (CRNI '08), November 2008
Akyildiz IF, Lee W-Y, Vuran MC, Mohanty S: NeXt generation/dynamic spectrum access/cognitive radio wireless networks: a survey. Computer Networks Journal 2006, 50(13):2127-2159. 10.1016/j.comnet.2006.05.001
Lunden J: Spectrum sensing for cognitive radio and radar systems, Dissertation for the degree of Doctor of Science in Technology. Helsinki University of Technology; November 2009.
Cordeiro C, Challapali K: C-MAC: a cognitive MAC protocol for multi-channel wireless networks. Proceedings of the IEEE International Symposium on Dynamic Spectrum Access Networks (DySPAN '07, April 2007 147-157.
Buddhikot MM, Kolodzy P, Miller S, Ryan K, Evans J: DIMSUMnet: new directions in wireless networking using coordinated dynamic spectrum. Proceedings of the IEEE International Symposium on a World of Wireless, Mobile and Multimedia Networks (WOWMOM '05), 2005 78-85.
Zhao Q, Tong L, Swami A: Decentralized cognitive MAC for dynamic spectrum access. Proceedings of the 1st IEEE International Symposium on Dynamic Spectrum Access Networks (DySPAN '05), November 2005 224-232.
Stanojev I, Simeone O, Bar-Ness Y, Yu T: Spectrum leasing via distributed cooperation in cognitive radio. IEEE International Conference on Communications (ICC '08), May 2008 3427-3431.
Suri NR, Narahari Y: An auction algorithm for procuring wireless channel in a heterogenous wireless network. Proceedings of the International Conference on Wireless and Optical Communications Networks (WOCN '08), April 2008
Zheng H, Cao L: Device-centric spectrum management. Proceedings of the 1st IEEE International Symposium on Dynamic Spectrum Access Networks (DySPAN '05), November 2005 56-65.
Shellhammer S, Juniga JC, Goldhammer M, Hu W: CoexistenceTutorial Material. IEEE 802 Whitespace Study Group, February, 2009
Urkowitz H: Energy detection of unknown deterministic signals. Proceedings of the IEEE 1972, 55: 523-531.
Gardner WA: Signal interception: a unifying theoretical framework for feature detection. IEEE Transactions on Communications 1988, 36(8):897-906. 10.1109/26.3769
Correia L: Mobile Broadband Multimedia Networks: Techniques, Models and Tools for 4G. Academic Press, New York, NY, USA; 2006.
Gill P, Arlitt M, Li Z, Mahanti A: YouTube traffic characterization: a view from the edge. Proceedings of the 7th ACM SIGCOMM Internet Measurement Conference (IMC '07), November 2007 15-28.
Weigle MC: Improving confidence in network simulations. Proceedings of the Winter Simulation Conference (WSC '06), December 2006, usa 2188-2194.
Author information
Authors and Affiliations
Corresponding author
Rights and permissions
Open Access This article is distributed under the terms of the Creative Commons Attribution 2.0 International License (https://creativecommons.org/licenses/by/2.0), which permits unrestricted use, distribution, and reproduction in any medium, provided the original work is properly cited.
About this article
Cite this article
Yoon, S., Lim, K. & Kim, J. Cross-Layer Dynamic Spectrum Map Management Framework for White Space Applications. J Wireless Com Network 2010, 870976 (2010). https://doi.org/10.1155/2010/870976
Received:
Accepted:
Published:
DOI: https://doi.org/10.1155/2010/870976